GGPLOT - sec_axis
This function is used in conjunction with a position scale to create a secondary axis, positioned opposite of the primary axis and then convert them with ggplotly.
p <- ggplot(mtcars, aes(cyl, mpg)) +
  geom_point()
p <-  p + scale_y_continuous(sec.axis = sec_axis(~ . + 10))
plotly::ggplotly(p)


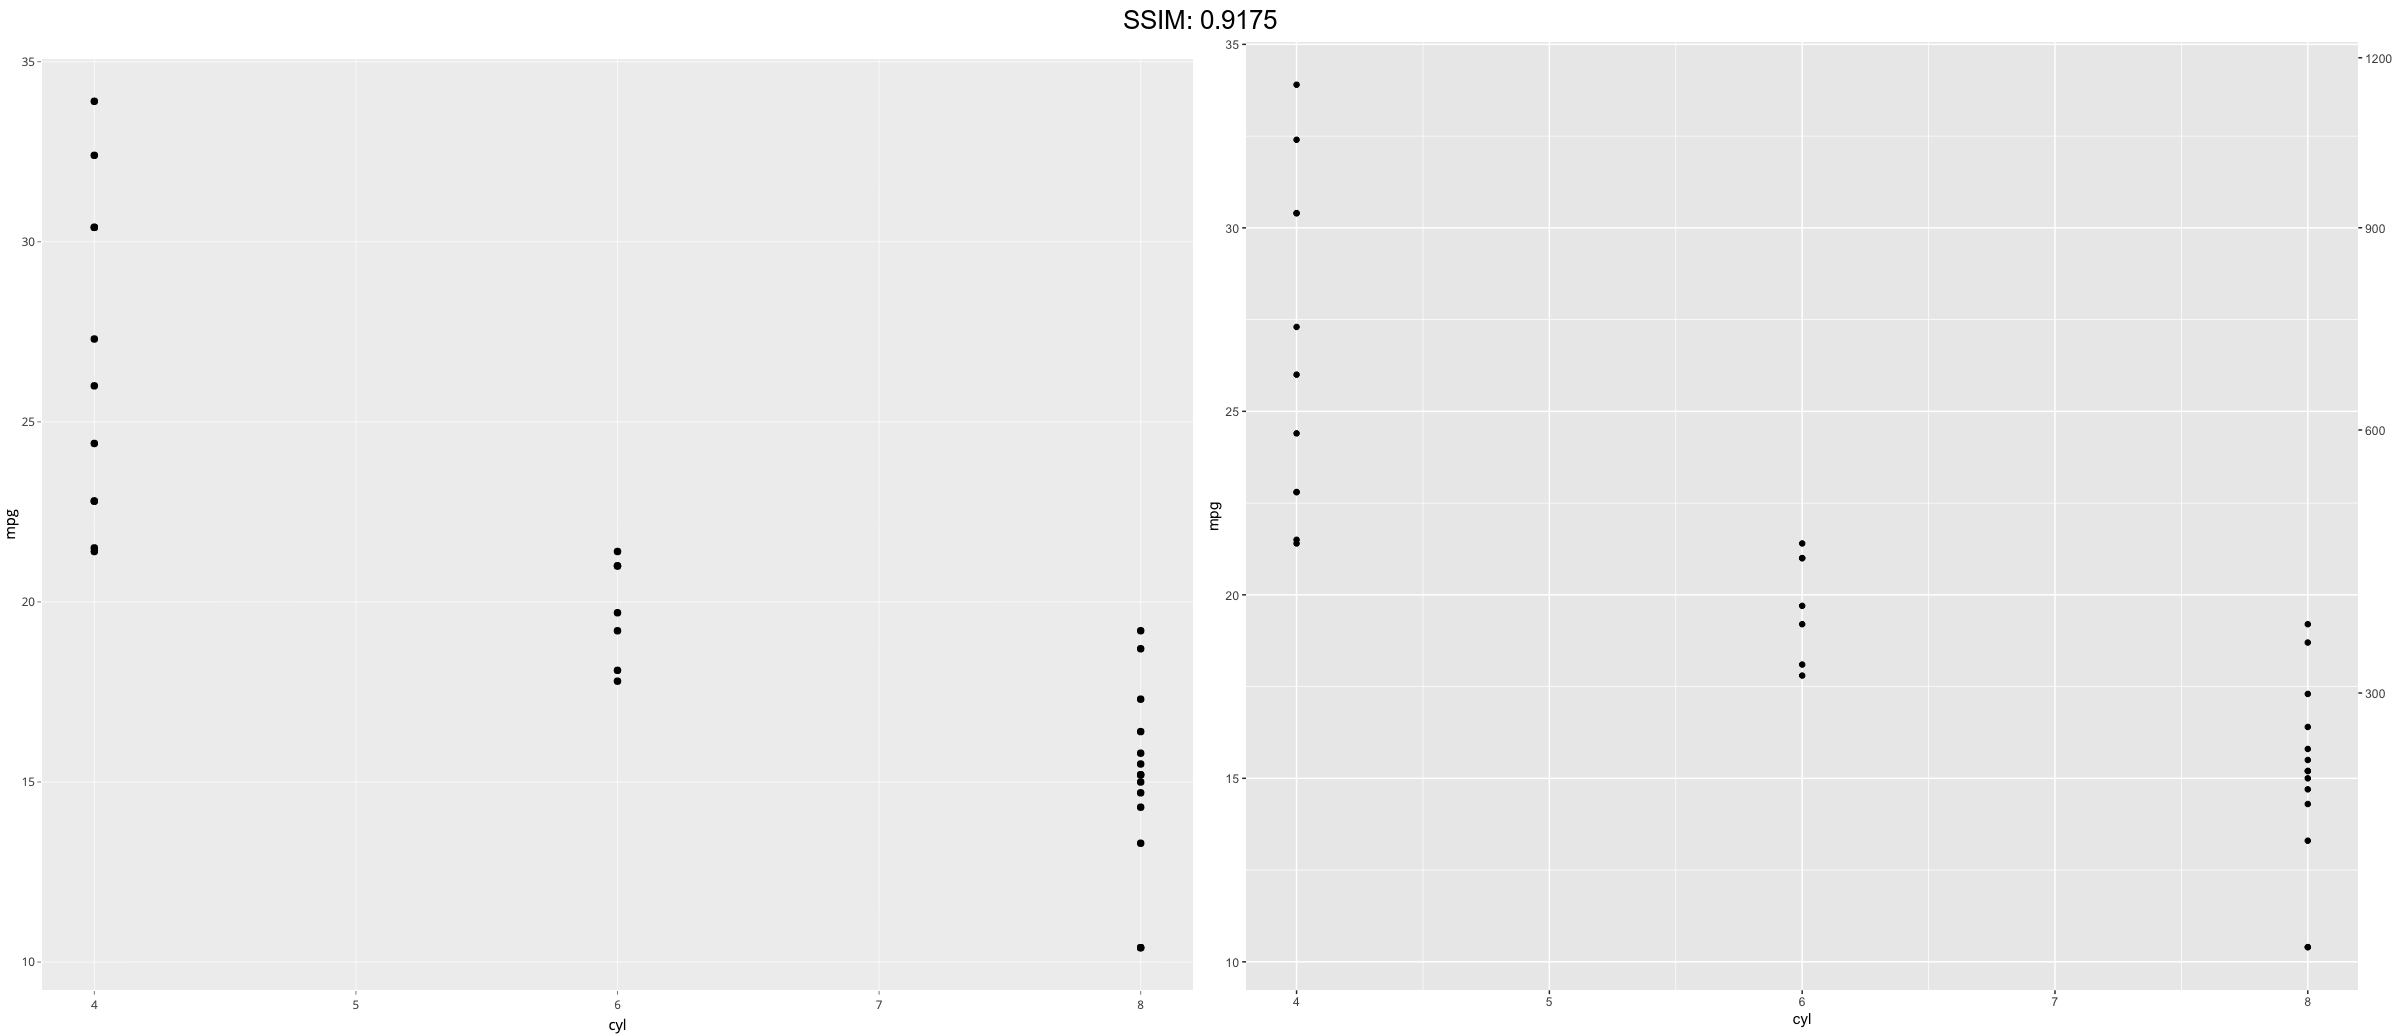
p <- ggplot(mtcars, aes(cyl, mpg)) +
  geom_point()
p <-  p + scale_y_continuous("Miles/gallon", sec.axis = sec_axis(~ . + 10, name = derive()))
plotly::ggplotly(p)


p <- ggplot(mtcars, aes(cyl, mpg)) +
  geom_point()
p <-  p + scale_y_continuous(sec.axis = dup_axis())
plotly::ggplotly(p)


p <- ggplot(mtcars, aes(cyl, mpg)) +
  geom_point()
p <-  p + scale_y_continuous(sec.axis = ~ .^2)
plotly::ggplotly(p)

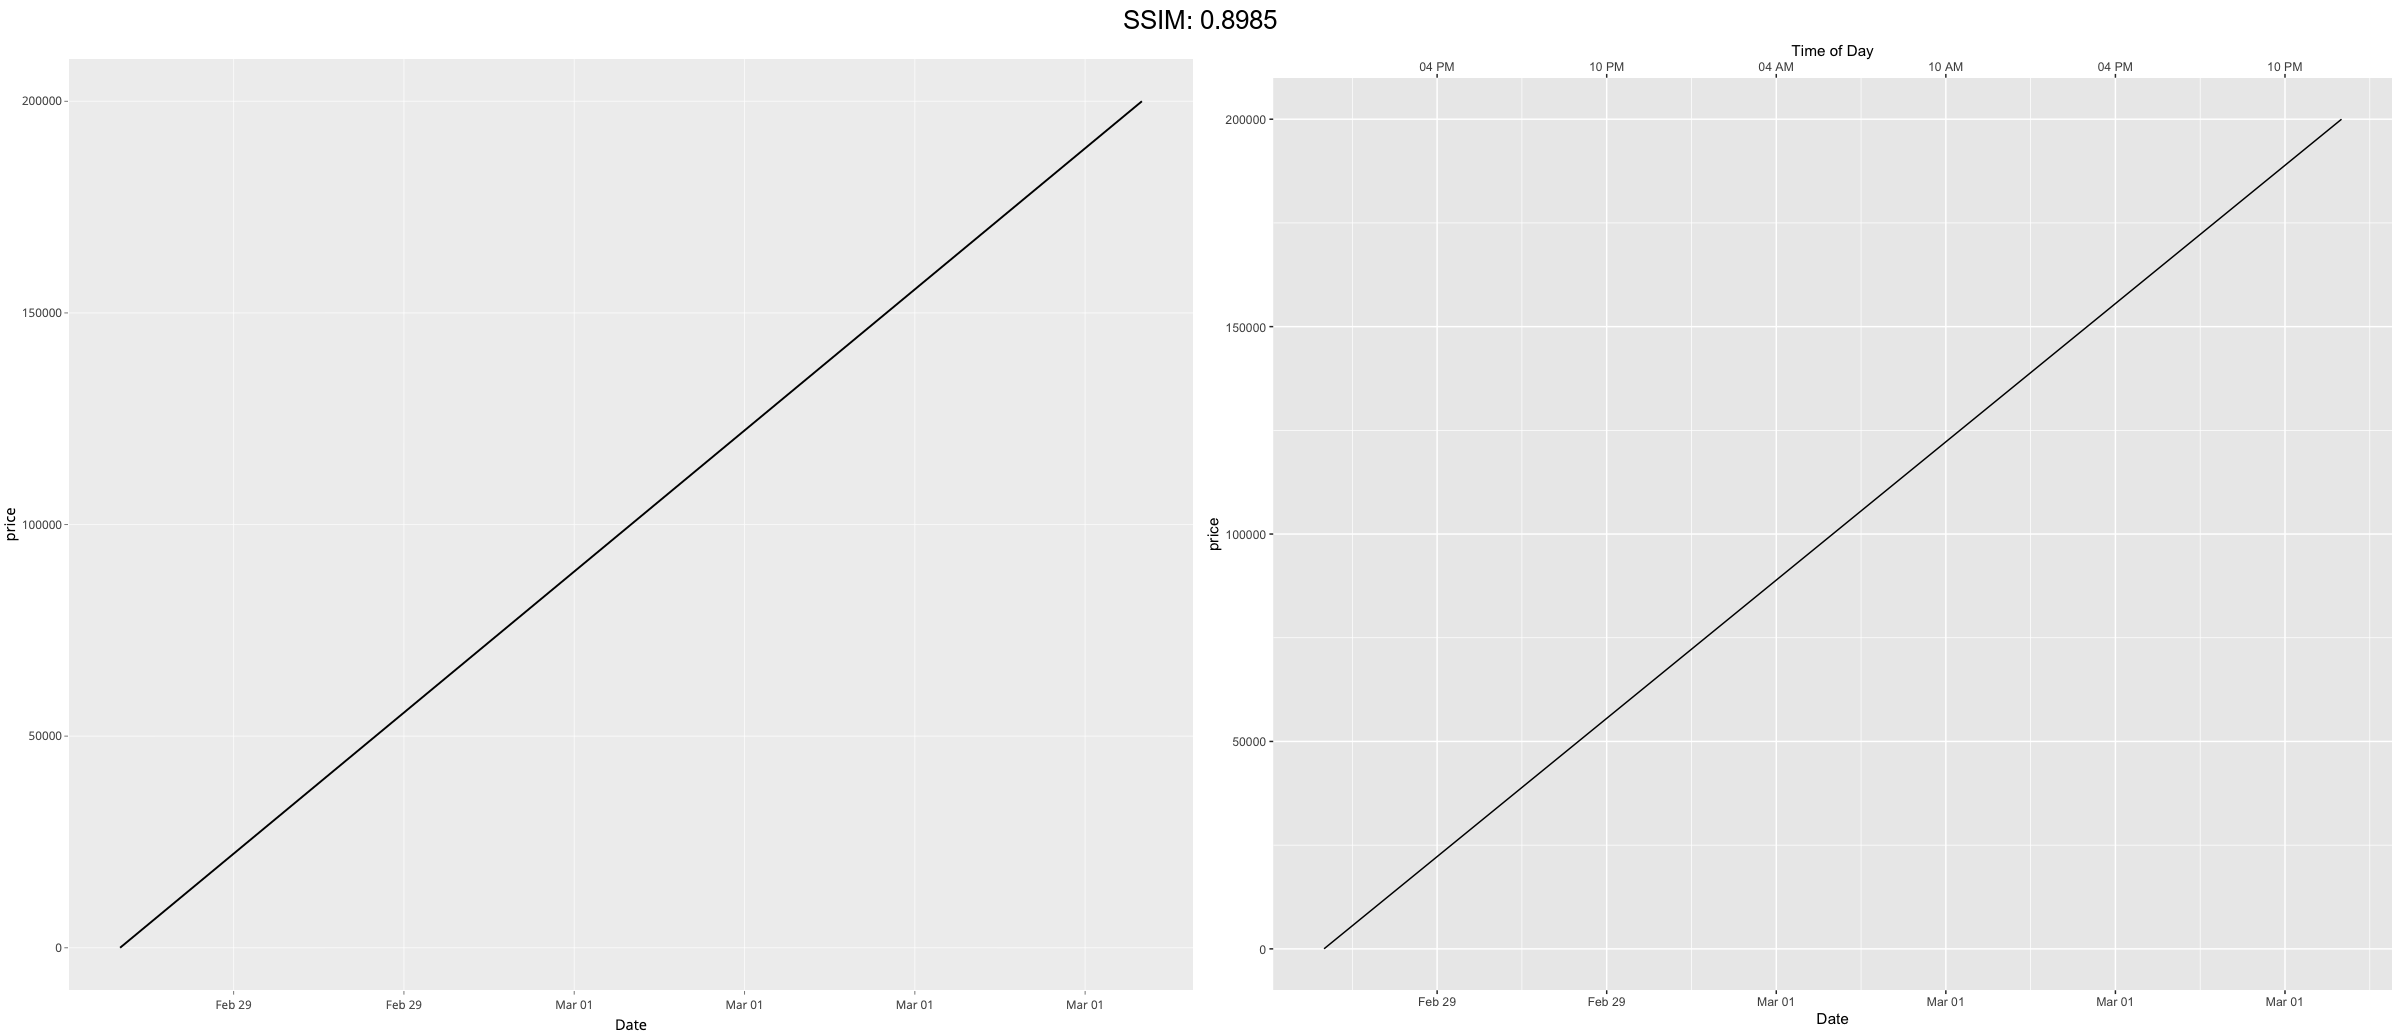
df <- data.frame(
  dx = seq(
    as.POSIXct("2012-02-29 12:00:00", tz = "UTC"),
    length.out = 10,
    by = "4 hour"
  ),
  price = seq(20, 200000, length.out = 10)
 )
p <-
 ggplot(df, aes(x = dx, y = price)) +
  geom_line() +
  scale_x_datetime(
    "Date",
    date_labels = "%b %d",
    date_breaks = "6 hour",
    sec.axis = dup_axis(
      name = "Time of Day",
      labels = scales::time_format("%I %p")
    )
  )
plotly::ggplotly(p)

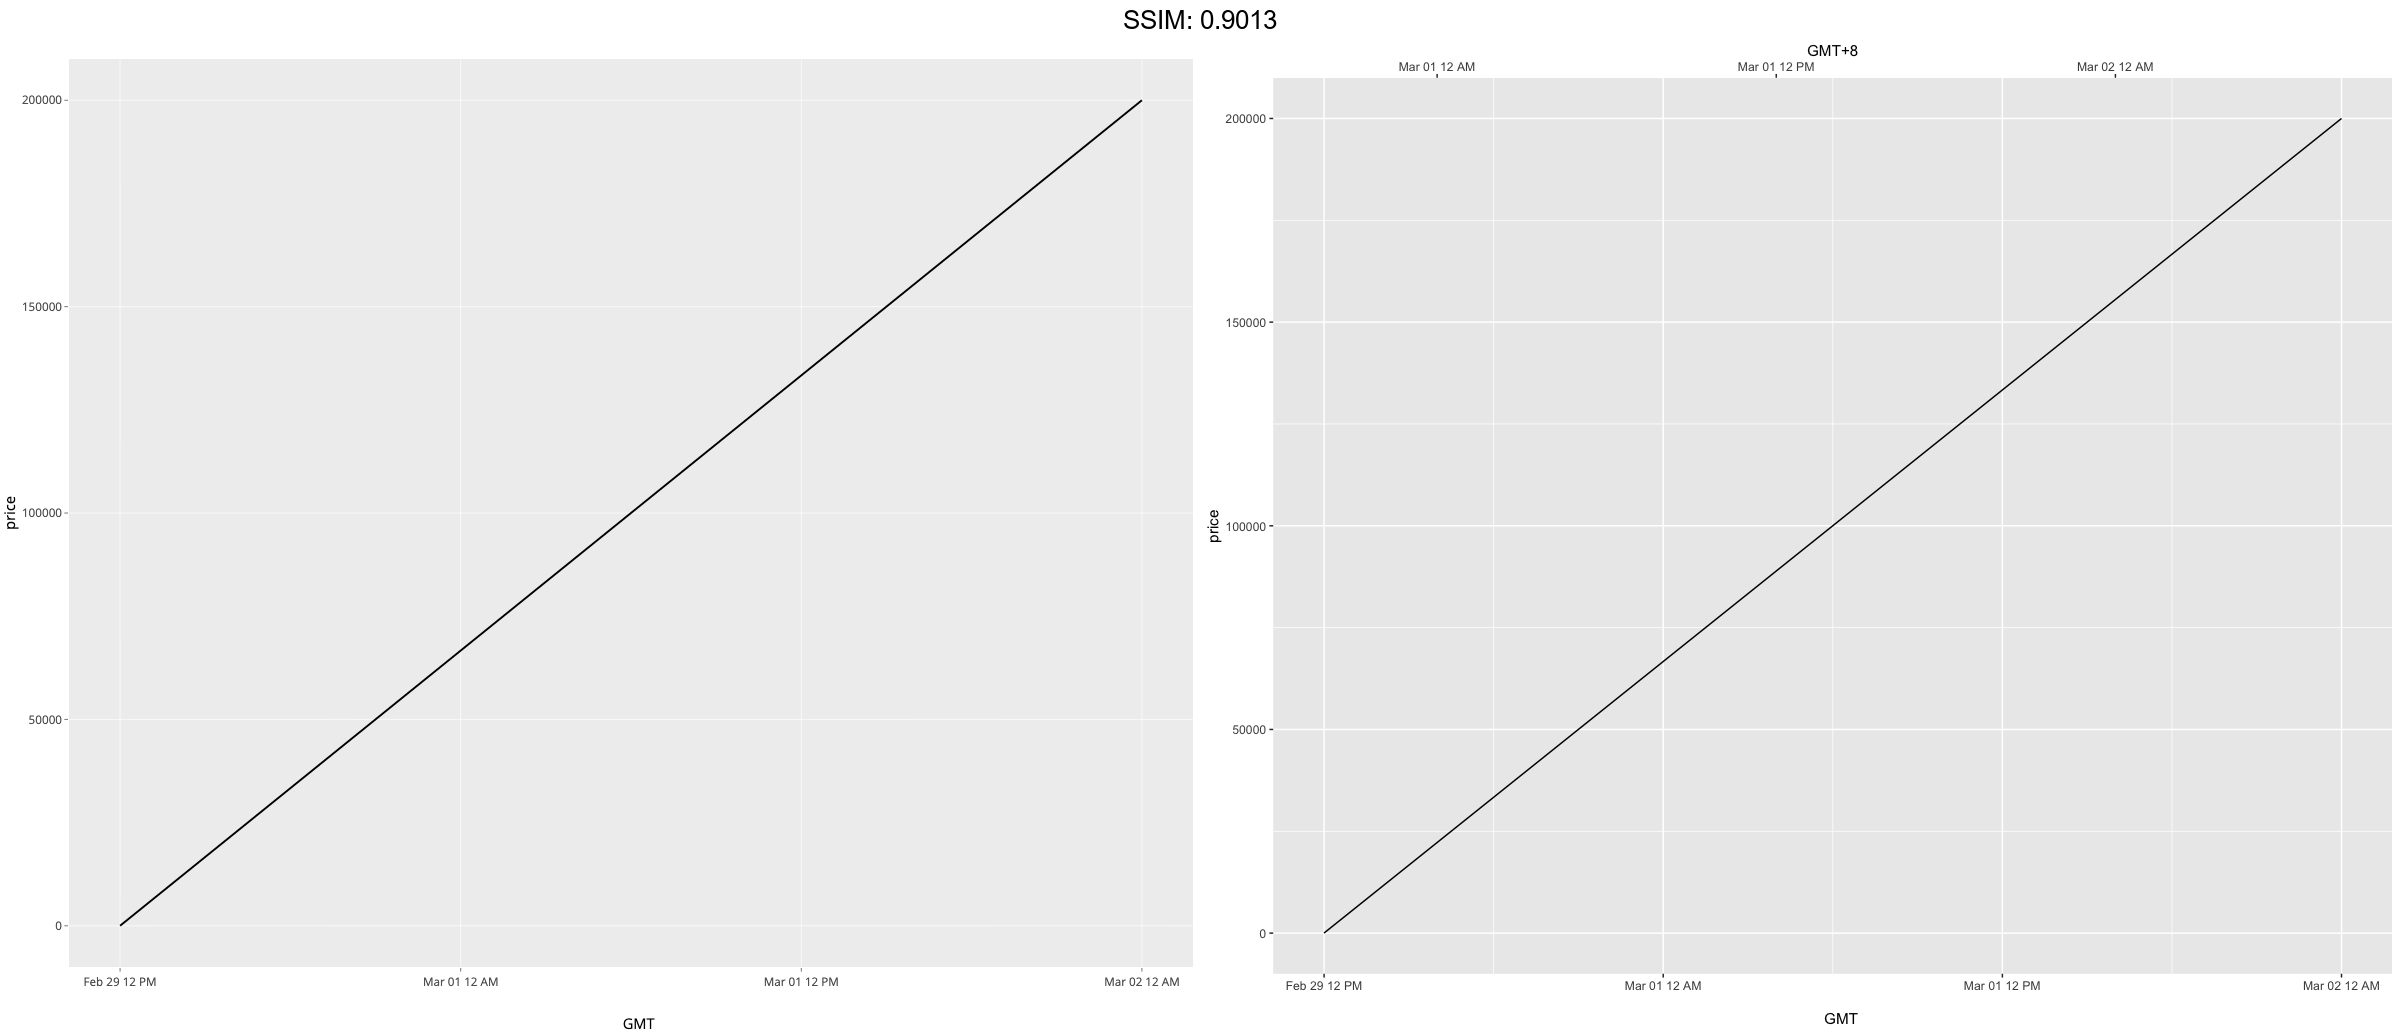
df <- data.frame(
  dx = seq(
    as.POSIXct("2012-02-29 12:00:00", tz = "UTC"),
    length.out = 10,
    by = "4 hour"
  ),
  price = seq(20, 200000, length.out = 10)
 )
p <-
 ggplot(df, aes(x = dx, y = price)) +
  geom_line() +
  scale_x_datetime("
    GMT",
    date_labels = "%b %d %I %p",
    sec.axis = sec_axis(
      ~ . + 8 * 3600,
      name = "GMT+8",
      labels = scales::time_format("%b %d %I %p")
    )
  )
plotly::ggplotly(p)